|
|
|
Tips for working with sound....
Unwanted distortion is caused by a signal which is "too strong". If an audio signal level is too high for a particular component to cope with, then parts of the signal will be lost. This results in the rasping distorted sound.
To illustrate this point, the pictures below represent a few seconds of music which has been recorded by a digital audio program. The maximum possible dynamic range (the range from quietest to loudest parts) of the signal is shown as 0 to +/-100 units
Click on the examples to hear them (Streaming Real G2).
|
In the first example, the amplitude (strength / height) of the signal falls comfortably within the +/-100 unit range. This is a well-recorded signal.
In the second example, the signal is amplified by 250%. In this case, the recording components can no longer accommodate the dynamic range, and the strongest portions of the signal are cut off. This is where distortion occurs. |
These examples can be used as an analogy for any audio signal. Imagine that the windows above represent a pathway through a component in a sound system, and the waves represent the signal travelling along the pathway. Once the component's maximum dynamic range is breached, you have distortion.
Distortion can occur at almost any point in the audio pathway, from the
microphone to the speaker. The first priority is to find out exactly where the
problem is.
Ideally, you would want to measure the signal level at as many points as
possible, using a VU (Volume Unit) meter or similar device. Generally speaking,
you should keep the level below about 0dBu at every point in the pathway.
If you can't measure the signal level, you'll have to do some deducing. Follow the entire audio pathway, beginning at the source (the source could be a microphone, tape deck, musical instrument, etc). Here are some things to look for:
Audio feedback is the ringing noise (often described as squealing,
screeching, etc) sometimes present in sound systems. It is caused by a
"looped signal", that is, a signal which travels in a continuous
loop.
In technical terms, feedback occurs when the gain in the signal loop reaches
"unity" (0dB gain).
One of the most common feedback situations is shown in the diagram below - a microphone feeds a signal into a sound system, which then amplifies and outputs the signal from a speaker, which is picked up again by the microphone.
Of course, there are many situations which result in feedback. For example, the microphone could be replaced by the pickups of an electric guitar. (In fact many guitarists employ controlled feedback to artistic advantage. This is what's happening when you see a guitarist hold his/her guitar up close to a speaker.)
To eliminate feedback, you must interrupt the feedback loop.
Here are a few suggestions for controlling feedback:
You could also try a digital feedback eliminator. There are various models available with varying levels of effectiveness. The better ones are reported to produce reasonable results.
Other Notes:
Feedback can occur at any frequency. The frequencies which cause most trouble will depend on the situation but factors include the room's resonant frequencies, frequency response of microphones, characteristics of musical instruments (e.g. resonant frequencies of an acoustic guitar), etc.
Feedback can be "almost there", or intermittent. For example, you might turn down the level of a microphone to stop the continuous feedback, but when someone talks into it you might still notice a faint ringing or unpleasant tone to the voice. In this case, the feedback is still a problem and further action must be taken.
Equalization, or EQ for short, means boosting or reducing (attenuating) the levels of different frequencies in a signal.
The most basic type of equalization familiar to most people is the treble/bass control on home audio equipment. The treble control adjusts high frequencies, the bass control adjusts low frequencies. This is adequate for very rudimentary adjustments — it only provides two controls for the entire frequency spectrum, so each control adjusts a fairly wide range of frequencies.
Advanced equalization systems provide a fine level of frequency control. The key is to be able to adjust a narrower range of frequencies without affecting neighbouring frequencies.
Equalization is most commonly used to correct signals which sound unnatural. For example, if a sound was recorded in a room which accentuates high frequencies, an equalizer can reduce those frequencies to a more normal level. Equalization can also be used for applications such as making sounds more intelligible and reducing feedback.
There are several common types of equalization, described below.
In shelving equalization, all frequencies above or below a certain point are boosted or attenuated the same amount. This creates a "shelf" in the frequency spectrum.
Graphic equalizers provide a very intuitive way to work — separate slider controls for different frequencies are laid out in a way which represents the frequency spectrum. Each slider adjusts one frequency band so the more sliders you have, the more control.
Parametric equalizers use bell equalization, usually with knobs for different frequencies, but have the significant advantage of being able to select which frequency is being adjusted. Parametrics are found on sound mixing consoles and some amplifier units (guitar amps, small PA amps, etc).
Audio Metering means using a visual display to monitor audio levels. This helps maintain audio signals at their optimum level and minimise degradation. There are two common types of meter which are used to measure audio levels:
Both types of meter are available in various forms including stand-alone units, components in larger systems, and software applications. Whatever the type of meter, two characteristics are important:
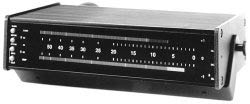
 A VU (volume unit) meter
is an audio metering device. It is designed to visually measure the
"loudness" of an audio signal.
A VU (volume unit) meter
is an audio metering device. It is designed to visually measure the
"loudness" of an audio signal.
The VU meter was developed in the late 1930s to help standardise transmissions over telephone lines. It went on to become a standard metering tool throughout the audio industry.
VU meters measure average sound levels and are designed to represent the way human ears perceive volume.
The rise time of a VU meter (the time it takes to register the level of a sound) and the fall time (the time it takes to return to a lower reading) are both 300 milliseconds.
The optimum audio level for a VU meter is generally around 0VU, often referred to as "0dB". Technically speaking, 0VU is equal to +4 dBm, or 1.228 volts RMS across a 600 ohm load.
VU meters work well with continuous sounds but poorly with fast transient sounds.
 A Peak
Program Monitor (PPM), sometimes referred to as a Peak Reading Meter
(PRM), is an audio metering device. It's general
function is similar to a VU meter but
there are some important differences.
A Peak
Program Monitor (PPM), sometimes referred to as a Peak Reading Meter
(PRM), is an audio metering device. It's general
function is similar to a VU meter but
there are some important differences.
The rise time of a PPM (the time it takes to register the level of a sound) is much faster than a VU meter, typically 10 milliseconds compared to 300 milliseconds. This makes transient peaks easier to measure.
The fall time of a PPM (the time it takes the meter to return to a lower reading) is much slower.
PPM meters are very good for reading fast, transient sounds. This is especially useful in situations where pops and distortion are a problem.
Audio Processing means changing the characteristics of an audio signal in some way. Processing can be used to enhance audio, fix problems, separate sources, create new sounds, as well as to compress, store and transmit data.
The following tutorials cover some common types of audio processing:
Audio compression is a method of reducing the dynamic range of a signal. All signal levels above the specified threshold are reduced by the specified ratio.
The example below shows how a signal level is reduced by 2:1 (the output level above the threshold is halved) and 10:1 (severe compression).
Compression Input vs Output Levels
Audio expansion means to expand the dynamic range of a signal. It is basically the opposite of audio compression.
Like compressors and limiters, an audio expander has an adjustable threshold and ratio. Whereas compression and limiting take effect whenever the signal goes above the threshold, expansion effects signal levels below the threshold.
Any signal below the threshold is expanded downwards by the specified ratio. For example, if the ratio is 2:1 and the signal drops 3dB below the threshold, the signal level will be reduced to 6dB below the threshold. The following graph illustrates two different expansion ratios — 2:1 and the more severe 10:1.
Input Level vs Output Level With Expansion
An extreme form of expander is the noise gate, in which lower signal levels are reduced severely or eliminated altogether. A ratio of 10:1 or higher can be considered a noise gate.
Note: Some people also use the term audio expansion to refer to the process of decompressing previously-compressed audio data.
A limiter is a type of compressor designed for a specific purpose — to limit the level of a signal to a certain threshold. Whereas a compressor will begin smoothly reducing the gain above the threshold, a limiter will almost completely prevent any additional gain above the threshold. A limiter is like a compressor set to a very high compression ratio (at least 10:1, more commonly 20:1 or more). The graph below shows a limiting ratio of infinity to one, i.e. there is no gain at all above a the threshold.
Input Level vs Output Level With Limiting
Threshold
Limiters are used as a safeguard against signal peaking (clipping). They prevent occasional signal peaks which would be too loud or distorted. Limiters are often used in conjunction with a compressor — the compressor provides a smooth roll-off of higher levels and the limiter provides a final safety net against very strong peaks.
Reverberation, or reverb for short, refers to the way sound waves reflect off various surfaces before reaching the listener's ear.
 The
example on the right shows one person (the sound source) speaking to another
person in a small room. Although the sound is projected most strongly toward
the listener, sound waves also project in other directions and bounce off the
walls before reaching the listener. Sound waves can bounce backwards and
forwards many times before they die out.
The
example on the right shows one person (the sound source) speaking to another
person in a small room. Although the sound is projected most strongly toward
the listener, sound waves also project in other directions and bounce off the
walls before reaching the listener. Sound waves can bounce backwards and
forwards many times before they die out.
When sound waves reflect off walls, two things happen:
The listener hears the initial sound directly from the source followed by the reflected waves. The reflections are essentially a series of very fast echoes, although to be accurate, the term "echo" usually means a distinct and separate delayed sound. The echoes in reverberation are merged together so that the listener interprets reverb as a single effect.
In most rooms the reflected waves will scatter and be absorbed very quickly. People are seldom consciously aware of reverb, but subconsciously we all know the difference between "inside sound" and "outside sound". Outside locations, of course, have no walls and virtually no reverb unless you happen to be close to reflective surfaces.
Some rooms result in more reverb than others. The obvious example is a hall with large, smooth reflective walls. When the hall is empty, reverb is most pronounced. When the hall is full of people, they absorb a lot of sound waves so reverb is reduced.
Reverberation can be added to a sound artificially using a reverb effect. This effect can be generated by a stand-alone reverb unit, the reverb effect in another device (such as a mixer or multi-effects unit), or by audio processing software.
There are three possible reasons for adding reverb:
Reverb is the most common audio effect, partly because it is used in so many situations from music studios to television production. Every sound operator should have a good understanding of reverb and how/when to apply it.
It pays to be judicious with reverb. Because it is so effective, it can easily be over-used. The right amount of reverb can do wonders for a singer's voice but too much sounds silly.
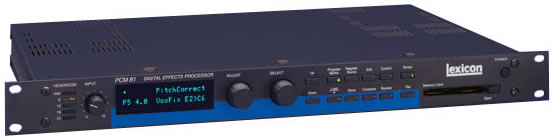
The photo below is a rack-mountable Lexicon PCM 81 Digital Effects Processor. This unit has a number of effects including reverb.
The screenshot below is from Adobe Audition, a sound editing package. It gives you an idea of some of the common reverb settings. Notice how most of the presets are described by the real-world effect they are simulating, for example, "Concert Hall" and "Medium Empty Room". This is common in reverb units.
Phase-shifting, AKA phasing, is an audio effect which takes advantage of the way sound waves interact with each other when they are out of phase. By splitting an audio signal into two signals and changing the relative phasing between them, a variety of interesting sweeping effects can be created.
The phasing effect was first made popular by musicians in the 1960s and has remained an important part of audio work ever since.
Phasing is similar to flanging, except that instead of a simple delay it uses notch and boost filters to to phase-shift frequencies over time.
The screenshot below is from Adobe Audition and shows some of the common settings available in phasing effects.
Flanging is a type of phase-shifting. It is an effect which mixes the original signal with a varying, slightly delayed version of the signal. The original and delayed signals are mixed more or less equally.
The following example is the flanger settings window in Adobe Audition. It shows some of the settings commonly used in flanging:
The chorus effect was originally designed to make a single person's voice sound like multiple voices saying or singing the same thing, i.e. make a soloist into a chorus. It has since become a common effect used with musical instruments as well.
The effect is a type of delay — the original signal is duplicated and played at varying lengths and pitches. This creates the effect of multiple sources, as each source is very slightly out of time and tune (just as in real life). Technically, a chorus is similar to a flanger.
Common parameters include:
|
Number of Voices: |
The number of times the source is multiplied. |
|
Delay: |
The minimum delay length, typically 20 to 30 milliseconds. |
|
Sweep Depth/ Width: |
The maximum delay length. |
The following example is the chorus settings window in Adobe Audition.
Certain noises are described by their colour, for example, the term "white noise" is common in audio production and other situations. Some of these names are official and technical, others have more loose definitions. These terms generally refer to random noise which may contain a bias towards a certain range of frequencies.
|
A term with numerous conflicting definitions, but most commonly refers to silence with occasional spikes. |
|
|
Contains more energy as the frequency increases. |
|
|
Mimics the signal noise produced by brownian motion. |
|
|
Similar to white noise, but has been filtered to make the sound level appear constant at all frequencies to the human ear. |
|
|
An unofficial term which can mean the mid-frequencies of white noise, or the "background noise of the world". |
|
|
An unofficial term describing noise which has been stripped of harmonious frequencies. |
|
|
Contains an equal sound pressure level in each octave band. Energy decreases as frequency increases. |
|
|
Contains more energy as the frequency increases. |
|
|
An oceanographic term which describes ambient underwater noise from distant sources. Also another name for brown noise. |
|
|
Contains an equal amount of energy in all frequency bands. |
Black noise has various definitions — as far as we are aware none of them are official. Some common definitions are listed below:
(1) Silence, no noise at all.
(2) Noise with a 1/fβ spectrum, where β > 2.
(3) Noise which has zero energy at most frequencies but contains occasional random spikes.
(4) The noise created by active noise control systems, designed to cancel existing noises.
(5) Ultrasonic white noise, i.e. white noise which is at a frequencies too high to hear but which can still affect the environment.
Blue noise, AKA azure noise, is similar to pink noise except the power density increases 3 dB per octave as the frequency increases. In technical terms the density is proportional to f (frequency).
 Brown noise is a
random noise which mimics the signal noise produced by brownian motion. Technically speaking, the spectral
density is proportional to 1/f2, which basically means it has more
energy at lower frequencies (decreasing by around 6dB per octave).
Brown noise is a
random noise which mimics the signal noise produced by brownian motion. Technically speaking, the spectral
density is proportional to 1/f2, which basically means it has more
energy at lower frequencies (decreasing by around 6dB per octave).
To the human ear, brown noise is similar to white noise but at a lower frequency. Examples in nature include waves on the beach and some wind noise.
Note: Some people use the term brown noise as a synonym for brown note, a controversial and unproven sound which causes the listener to lose control of their bowels.
Gray noise is a random noise which sounds the same at all frequencies to the human ear. This is not the same as white noise, which has the same energy at all frequencies. Rather, gray noise is subjected to a "psycho acoustic equal loudness curve" which compensates for the bias of the human ear so that it sounds the same at all frequencies.
Green noise is not an officially recognised term. There are several unofficial definitions in use — these appear to be the two most common:
(1) The mid-frequency component of white noise.
(2) "The background noise of the world", a sort of new-age description of ambient noise averaged from several different outdoors locations. Similar in sound to pink noise with an emphasis on the range around 500Hz.
The semi-official definition of orange noise is "a quasi-stationary noise with a finite power spectrum with a finite number of small bands of zero energy dispersed throughout a continuous spectrum." We have not been able to determine where this definition originated but it is commonly used in reference material.
Orange noise relates to musical scales. The bands of zero energy coincide with the notes in the scale. In effect this means that the in-tune notes of a scale are removed, leaving only the out-of-tune frequencies. This creates a clashing, displeasing noise.
 Pink noise (AKA 1/f
noise or flicker noise) is similar to white noise
except that it contains an equal amount of energy in each octave band. To put
it technically, the power spectral density is proportional to the reciprocal of
the frequency.
Pink noise (AKA 1/f
noise or flicker noise) is similar to white noise
except that it contains an equal amount of energy in each octave band. To put
it technically, the power spectral density is proportional to the reciprocal of
the frequency.
Sound engineers use pink noise to test whether a system has a flat frequency
response.
Pink noise can be generated by putting white noise through a pinking
filter which removes more energy as the frequency increases (approximately
3 dB per octave).
As white noise is anagous to white light
(representing all frequencies equally), pink noise is anagous
to light which tends towards the lower end of the visible light spectrum (red
light).
Purple noise is similar to brown noise
except that the power density increases 6 dB per octave as the frequency
increases. In technical terms the density is proportional to f2.
Red noise has two common definitions:
(1) Another name for brown noise.
(2) An oceanographic term which describes the ambient noise of distant
underwater objects.
The "red" name reportedly refers to the loss of higher frequencies
and the emphasis on lower frequencies (this is from the white noise
/ white light analogy). This would apply to either of the above definitions.
Red noise is not nearly as clearly defined as white or pink noise. Some
definitions found on the web conflict with each other, for example, some
sources define red noise as a synonym for pink noise.
 White noise is a
random noise that contains an equal amount of energy in all frequency bands.
White noise is a
random noise that contains an equal amount of energy in all frequency bands.
White noise is the equivalent of white light, in fact this is how it gets it's name. White light is made up of all light frequencies (colours), while white noise is made up of all audio
frequencies.
White noise is used in electronic music, either directly as a sound effect
or as the basis to create synthesized sounds. For example, many percussion
instruments have a high component of white noise.
White noise is also used to mask other sounds. This process takes advantage
of the way the human brain works — the brain is able to single out simple
frequency ranges but has trouble when too many frequencies are heard at once.
When white noise is present, other noises appear diminished.
White noise is available on CDs etc, marketed as a noise reducer or sleeping
aid.